The profiling pin goes high before a 100 ms delay. Only after that wait does the program start the microsecond timer, call run_classifier, stop the timer and lower the pin. The pulse and the timer therefore describe different intervals even though they are close together in the code.
Audio capture happens earlier. The application fills the complete input buffer and wraps it as a signal before raising GPIO 4. That gives me three useful boundaries to keep separate: the complete listening route, the high pulse and the processing call inside the timer. A sharp digital edge can make a measurement look definite, but its meaning still comes from the instructions between the edges. I want to read that order before giving the pulse a shorter name.
That difference is easy to miss if I only look at a capture. A clear high pulse looks like a clear answer to when inference happens. But the pulse marks whatever the programmer put between high and low. The instrument can't know that I wanted the name inference to exclude a wait I deliberately left inside it.
I'm writing the order in plain words first: capture the audio, raise the pin, wait, start the timer, run processing and classification, stop the timer, lower the pin. Printing and another wait appear elsewhere in the loop. This sequence is more useful than one box labelled benchmark because I can see exactly where the boundaries split.
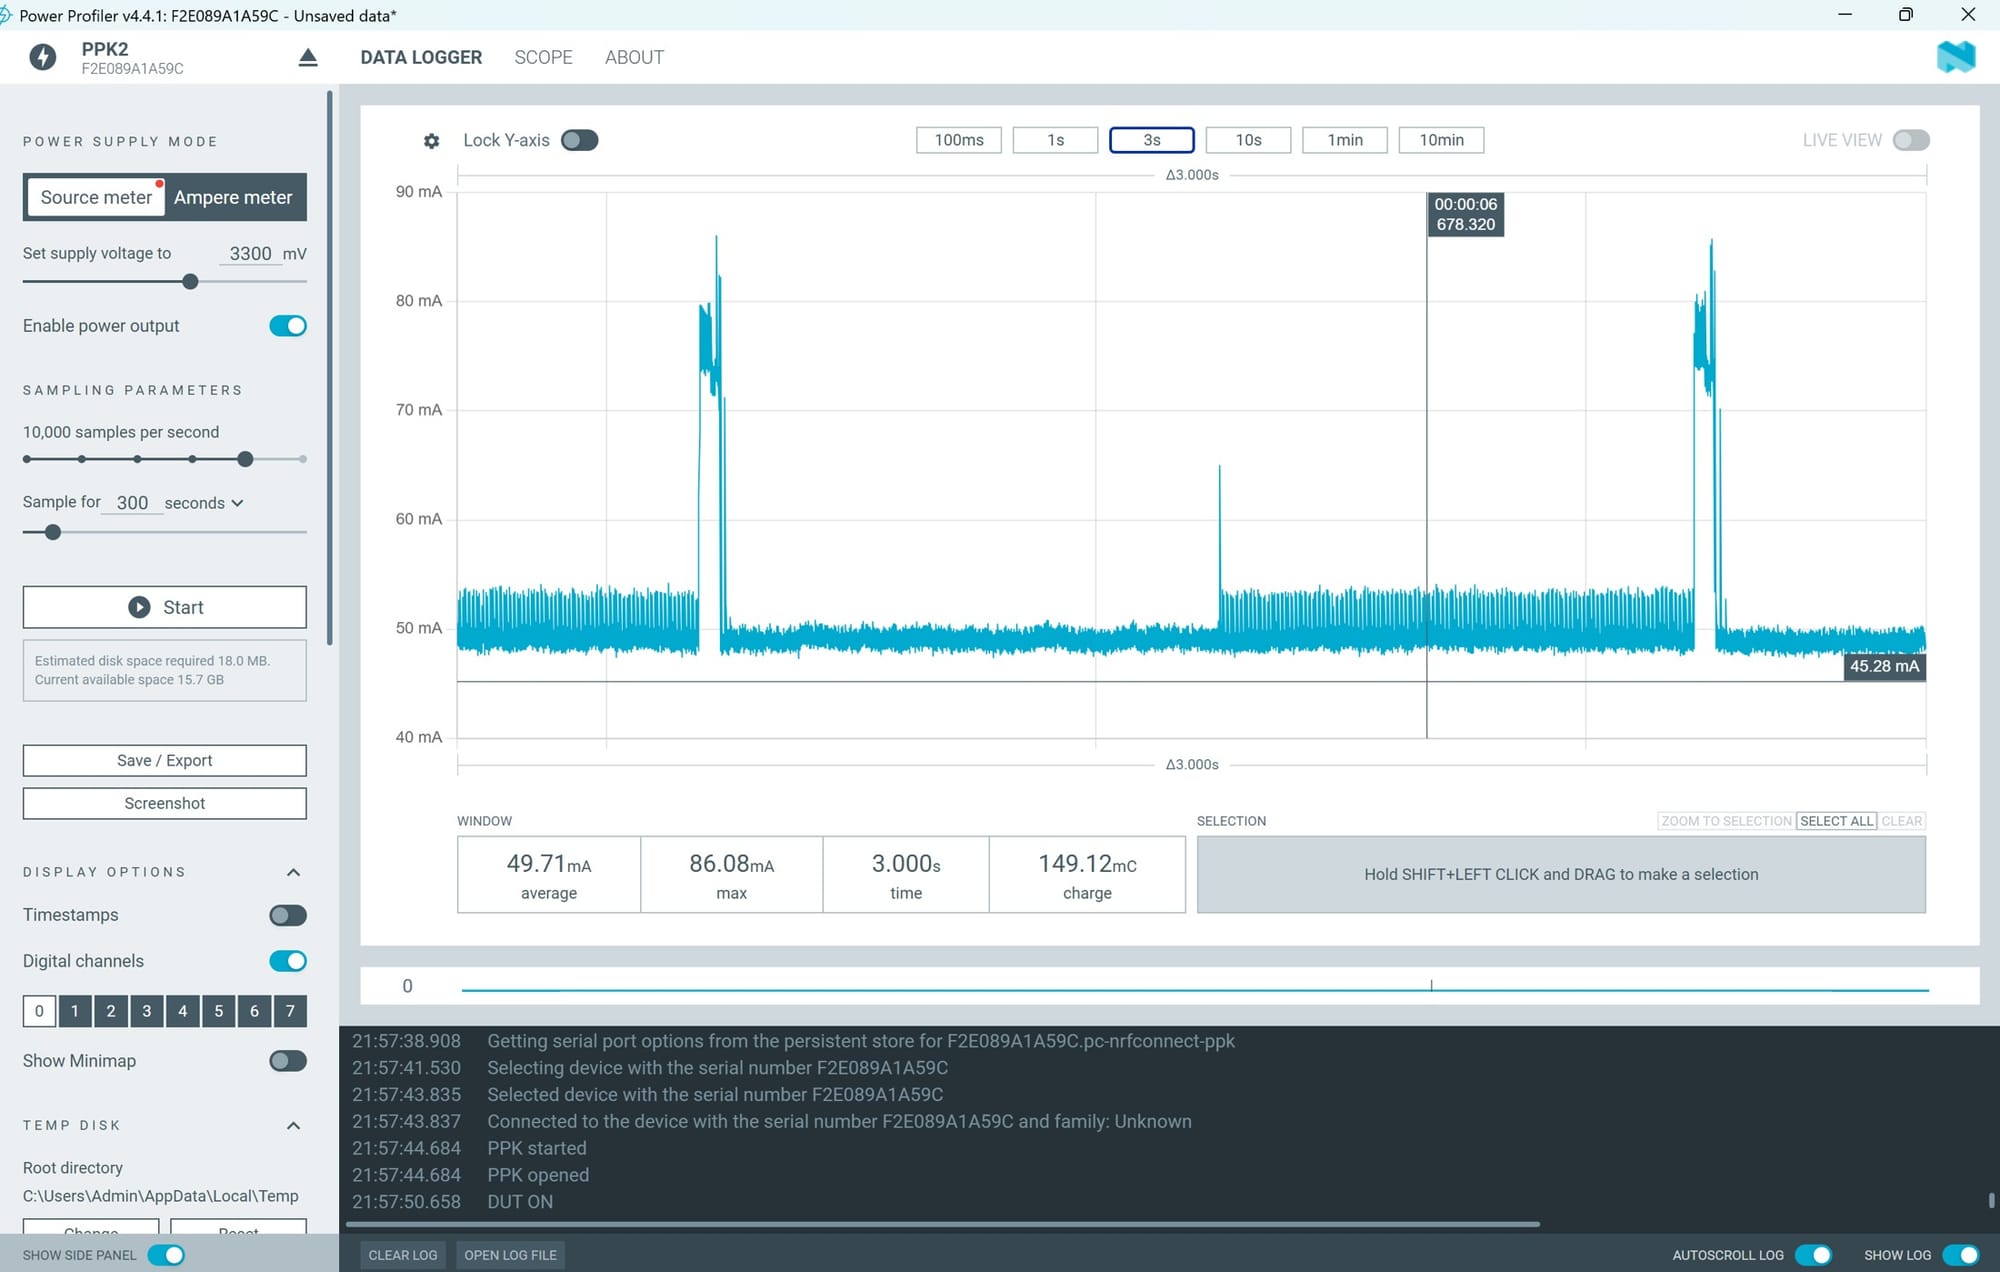
The audio capture is before the pin goes high. That means a high-pulse measurement doesn't include the microphone window being acquired. If I use it to describe the entire cost of hearing a word and producing a prediction, I would have left out a real part of that route. It might still be useful for a narrower processing question, provided the label says so.
The deliberate 100 ms wait is inside the high interval but before the microsecond timer. Its purpose in the code is to make the pulse easier to see. The board continues drawing current while waiting. Even if the wait contains no classifier work, its electrical energy is part of a selection covering the complete high pulse.
After the wait comes run_classifier. Despite the name, the call includes signal processing as well as the classification work in this exported pipeline. The SDK supplies separate timing fields for DSP and classification. So there are at least three useful boundaries to keep distinct: the pin's high interval, the external timer around the call and the SDK's individual stages.
The high interval includes the deliberate delay and the call, along with the surrounding overhead. The microsecond timer excludes that initial delay but covers the call. The DSP and classification fields describe the internal stages they time. Comparing these numbers can help explain the program, but only if I stop expecting them all to be equal.
A timing example makes the difference obvious. In this case, feature processing took 25 ms and classification took 5 ms in a run. A timer around the full call might show roughly 30 ms plus relevant overhead. The high pulse, with the extra 100 ms wait, would last roughly 130 ms plus its overhead. I kept the stage timings beside the total. They show how a perfectly functioning marker can produce a much larger interval than the classifier stage.
If I then called that 130 ms neural-network time, I would have combined a deliberate wait, processing and classification into one misleading value. Nothing would need to be wrong with the profiler or timer for that mistake to happen. The error would be in my description of the code.
Energy needs even more care because current needn't stay constant across those stages. I can't subtract 100 ms from a duration and assume I have also removed the wait's energy. To remove an energy contribution, I need to know the current during the relevant interval, or select the correct region of the matched trace. Time and energy are related, but they are not interchangeable numbers.
In another check, a constant 50 mA during a 100 ms wait at 3.3 V would contribute 16.5 mJ. That’s a substantial-looking amount beside a small processing task. It isn't the measured waiting energy in our capture; it is a simple calculation showing why the added interval deserves attention. A different waiting current would give a different contribution.
The separate SDK timings have their own purpose. They can help me see whether feature extraction or classification takes more time in an actual run. They don't automatically describe the total application delay experienced by someone speaking, and they don't directly measure the energy of each stage. I need to keep their units and definitions beside them.
There’s also a difference between observing the pulse and observing the task. The marker instructions themselves are part of the running program. For this question, the obvious problem is the large extra wait, not a tiny overhead correction. Still, I want to understand which edges define the interval and use the same definition when comparing versions. Consistency matters more than printing extra decimal places.
The matching trace is important. An old screenshot and a newer sketch can both be genuine while describing different behaviour. If I remove the delay later, the earlier capture doesn't retroactively become a measurement without it. The source version and capture need to remain linked so the explanation doesn't quietly move ahead of the evidence.
I want my mentor to check the sequence with me rather than just look at the final duration. We can point to each boundary and say what is inside it. That should make it easier to decide which interval answers the actual project question. If the target is feature processing plus classification, say that. If it is the complete listening cycle, the capture stage belongs too.
The useful result of reading the sequence is a clear boundary for the measurement. A different marker would answer a different question, so a comparison between versions should keep the name and the interval together. A smaller number is only useful when I can explain what has become smaller.
The serial labels need the same care as the pulse. The line named NN Inference Time places the SDK's classification milliseconds beside microseconds from the timer around the whole call. Those are different scopes. Total Pipeline Time adds the SDK's DSP and classification fields; it does not include the earlier audio acquisition or the final one-second delay. Reading the labels with the actual sequence is more useful than expecting all the displayed times to agree.
The hundred-millisecond line is ordinary code. It doesn't look important beside the model and the microphone setup. But it changes the meaning of a pulse I might otherwise have trusted immediately. I’m leaving the sequence written out beside the capture: audio, high, wait, timed call, low. The order is now the first thing I want to read.