The validation screen gives 88.2% accuracy and a loss of 0.28. The confusion matrix makes the result more particular: the OFF and ON rows are in their correct columns, while the noise row is split equally between ON and noise. That’s the part I want to understand before treating the overall percentage as the whole result.
This is a validation result. It’s different from the separate test split and from live microphone behaviour. For a command recogniser, noise becoming ON is a specific kind of error, even when the total score looks encouraging. The screen gives me a concrete place to begin thinking about the model: which kind of decision is it making, and what does that say about the examples used in this evaluation?
I'm reading the matrix as actual labels against predicted labels. A correct prediction appears where those agree. A mistake appears somewhere else. It helps me stop thinking of the model as simply right or wrong in one general way. It can have a particular confusion that deserves attention while doing better on other examples.
The noise row is especially useful because it raises a practical question. What sounds are being turned into ON? The table can't tell me that by itself. I need to return to the corresponding recordings. They might have something in common, or they might expose several different gaps. Choosing a reason before hearing the examples would be guessing.
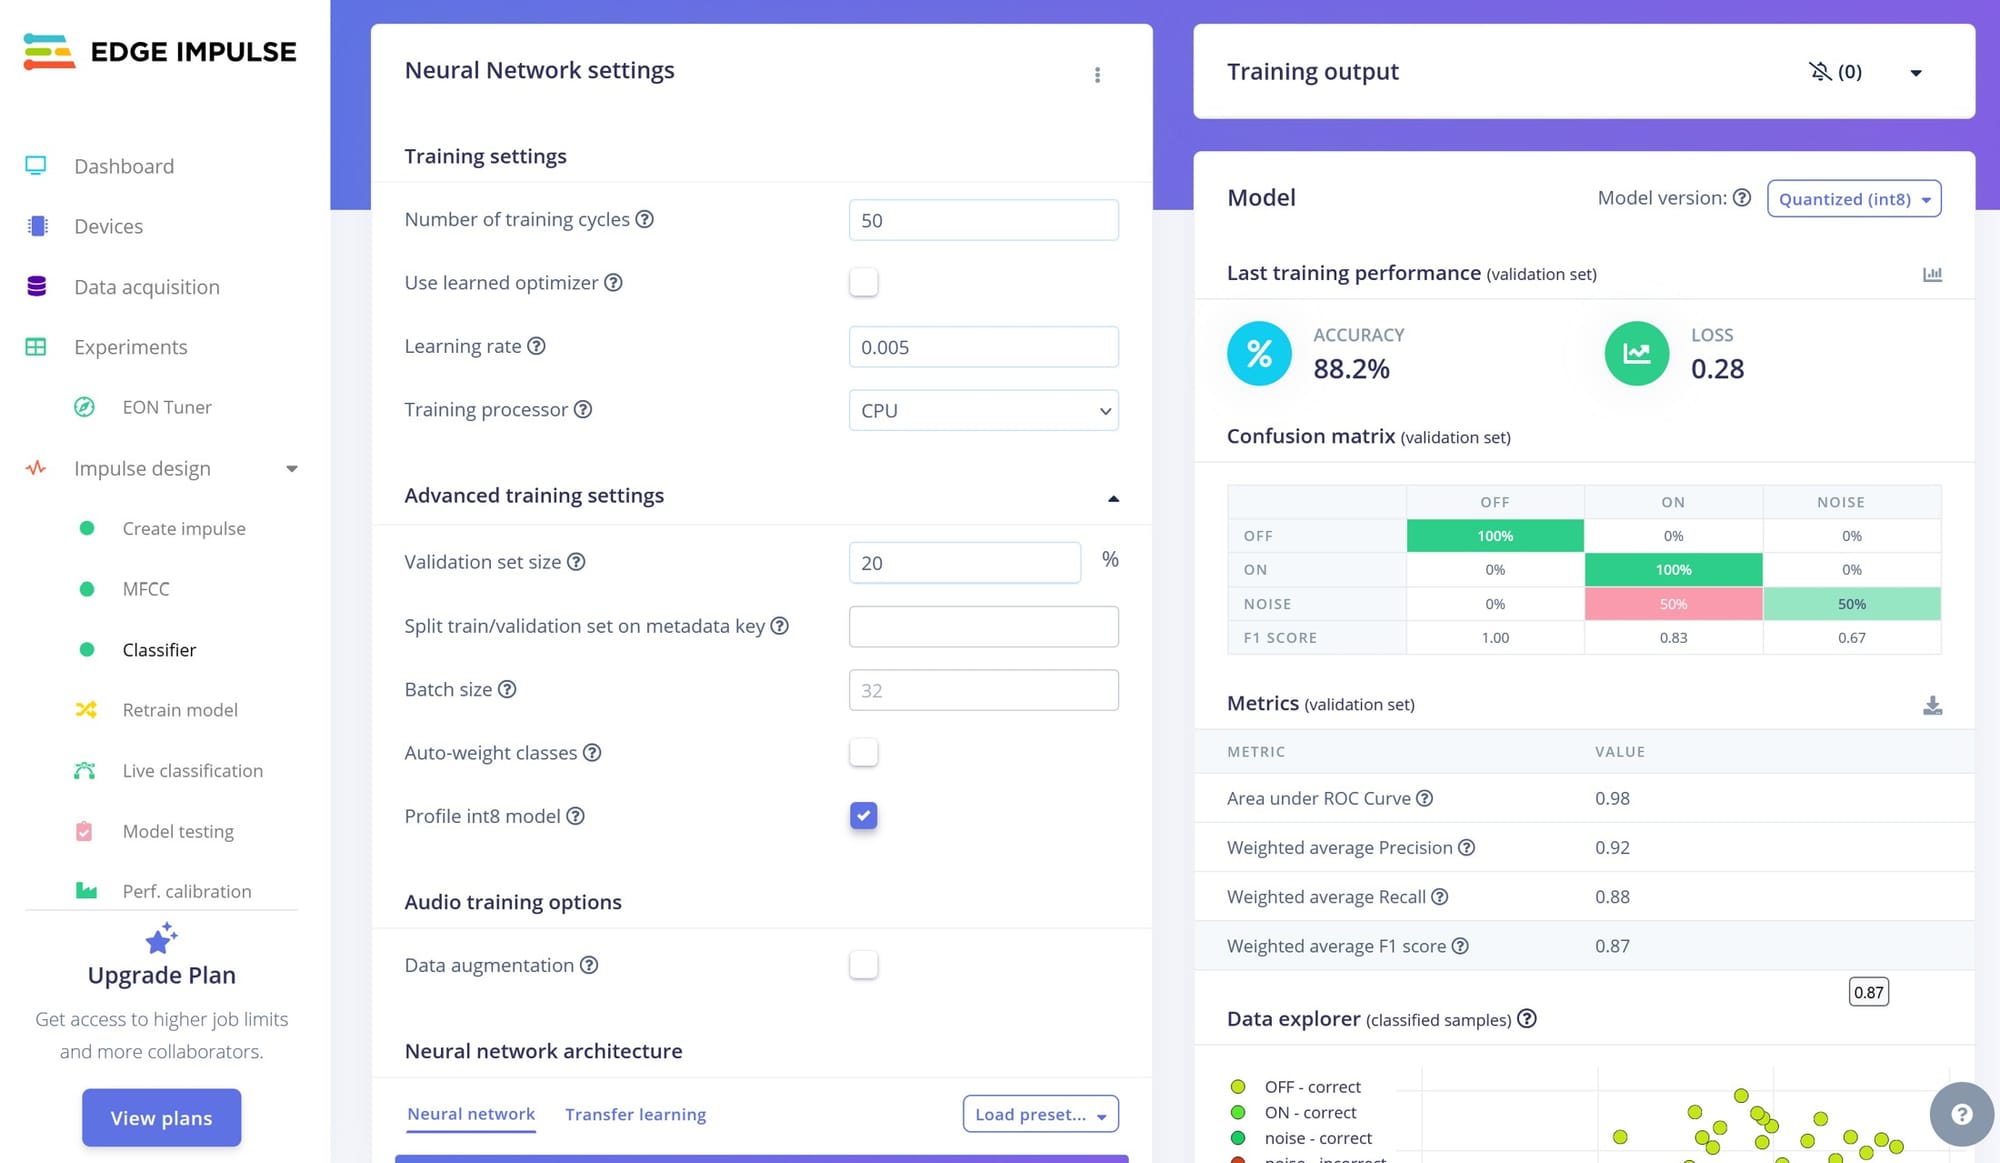
I also need to keep the name of the evaluation attached to 88.2%. This is validation. It isn't the result on the separate held-out test clips, and it isn't a measured percentage for the live microphone. Those are further questions. Calling all of them accuracy without saying where it came from would make the project sound more settled than it is.
A confusion example helps me see why the average can hide something important. Imagine ten ON examples, ten OFF examples and ten noise examples. In this case, all command examples were correct, but five noise examples became ON. That model would get 25 out of 30 right, about 83.3%, while still producing a command on half the noise examples. This is not the count behind our screenshot. It’s a simple example showing why a respectable-looking total can coexist with a troublesome error.
The consequences of the errors aren't necessarily equal either. Predicting noise when I actually say ON means a missed command. Predicting ON during noise means an unwanted command. Which matters more depends on what a finished device would do afterwards. I haven't attached this project to a verified appliance-control system, so I shouldn't invent consequences from a demonstration that hasn't been described. But I can already see why those two mistakes would need separate attention.
A threshold could be another part of a later application: how confident must the model be before a prediction is acted on? That still wouldn't be a magic repair. Raising a threshold can reduce some unwanted decisions while missing more genuine commands. To understand that tradeoff, I would need results across examples, not simply one attractive confidence value.
The size and composition of the evaluation also matter. A percentage from a small set can move when only a few examples change. I don't want to turn the noise row into a universal claim about half of all background sound in the world. It describes the examples in this evaluation. The value is a clue about what to investigate, not the final description of every future environment.
This makes the next data question much better. Instead of adding recordings just to increase the total, I can look for situations connected to the mistakes. What did the noise class contain? Was the audio collected in the same way as the commands? Were the clips labelled and cut sensibly? Those are inspectable questions that connect the model's behaviour back to the input.
I want to keep the original screen and the matching configuration together. If I run a different setup later, I need to know whether the data, feature processing or model changed. Otherwise I might celebrate an improvement without knowing what produced it. The old mistakes are useful information, not something to erase once the new score is larger.
For a mentor discussion, I'd rather bring a few specific confusing examples than only the percentage. We could listen, look at their features and ask what comparison would tell us something. A worked example can help explain the matrix or suggest categories of possible causes. It can't determine which cause applies without the recordings and actual checks.
I also want to resist the urge to keep retraining until the display looks better. The validation examples are part of how choices get made. If I keep adjusting based on them, I still need a separate check before claiming the change works more generally. A nicer number after many attempts isn't automatically evidence about new conditions.
The useful progress today is that I can read more of the screen. The score summarises something; the matrix opens that summary back up. It tells me where the next question lives, and that question is close enough to the audio that I can start investigating it.
The configuration beside the matrix matters as well: 50 training cycles, learning rate 0.005, batch size 32 and a 20% validation setting. I can keep those conditions with the result rather than treat 88.2% as a permanent property of the model. The 100% entries in the command rows belong to this validation matrix too. They are not a promise that every future voice, room or microphone will be classified correctly. The row proportions tell me what happened within this evaluation, not its missing real-world denominator.
I'm still pleased that there is a model result to examine. I just don't want 88.2% to become the whole story when the noise row is giving me a more interesting one. Before trying to improve the headline, I want to understand those sounds that the model thinks are ON.