I compared the two converters on the bench and recorded peak efficiencies of 96% for the XL4015 and 95% for the MP2307DN. Keeping the input, output and load conditions beside each reading helped me understand why the percentages changed across the sweep.
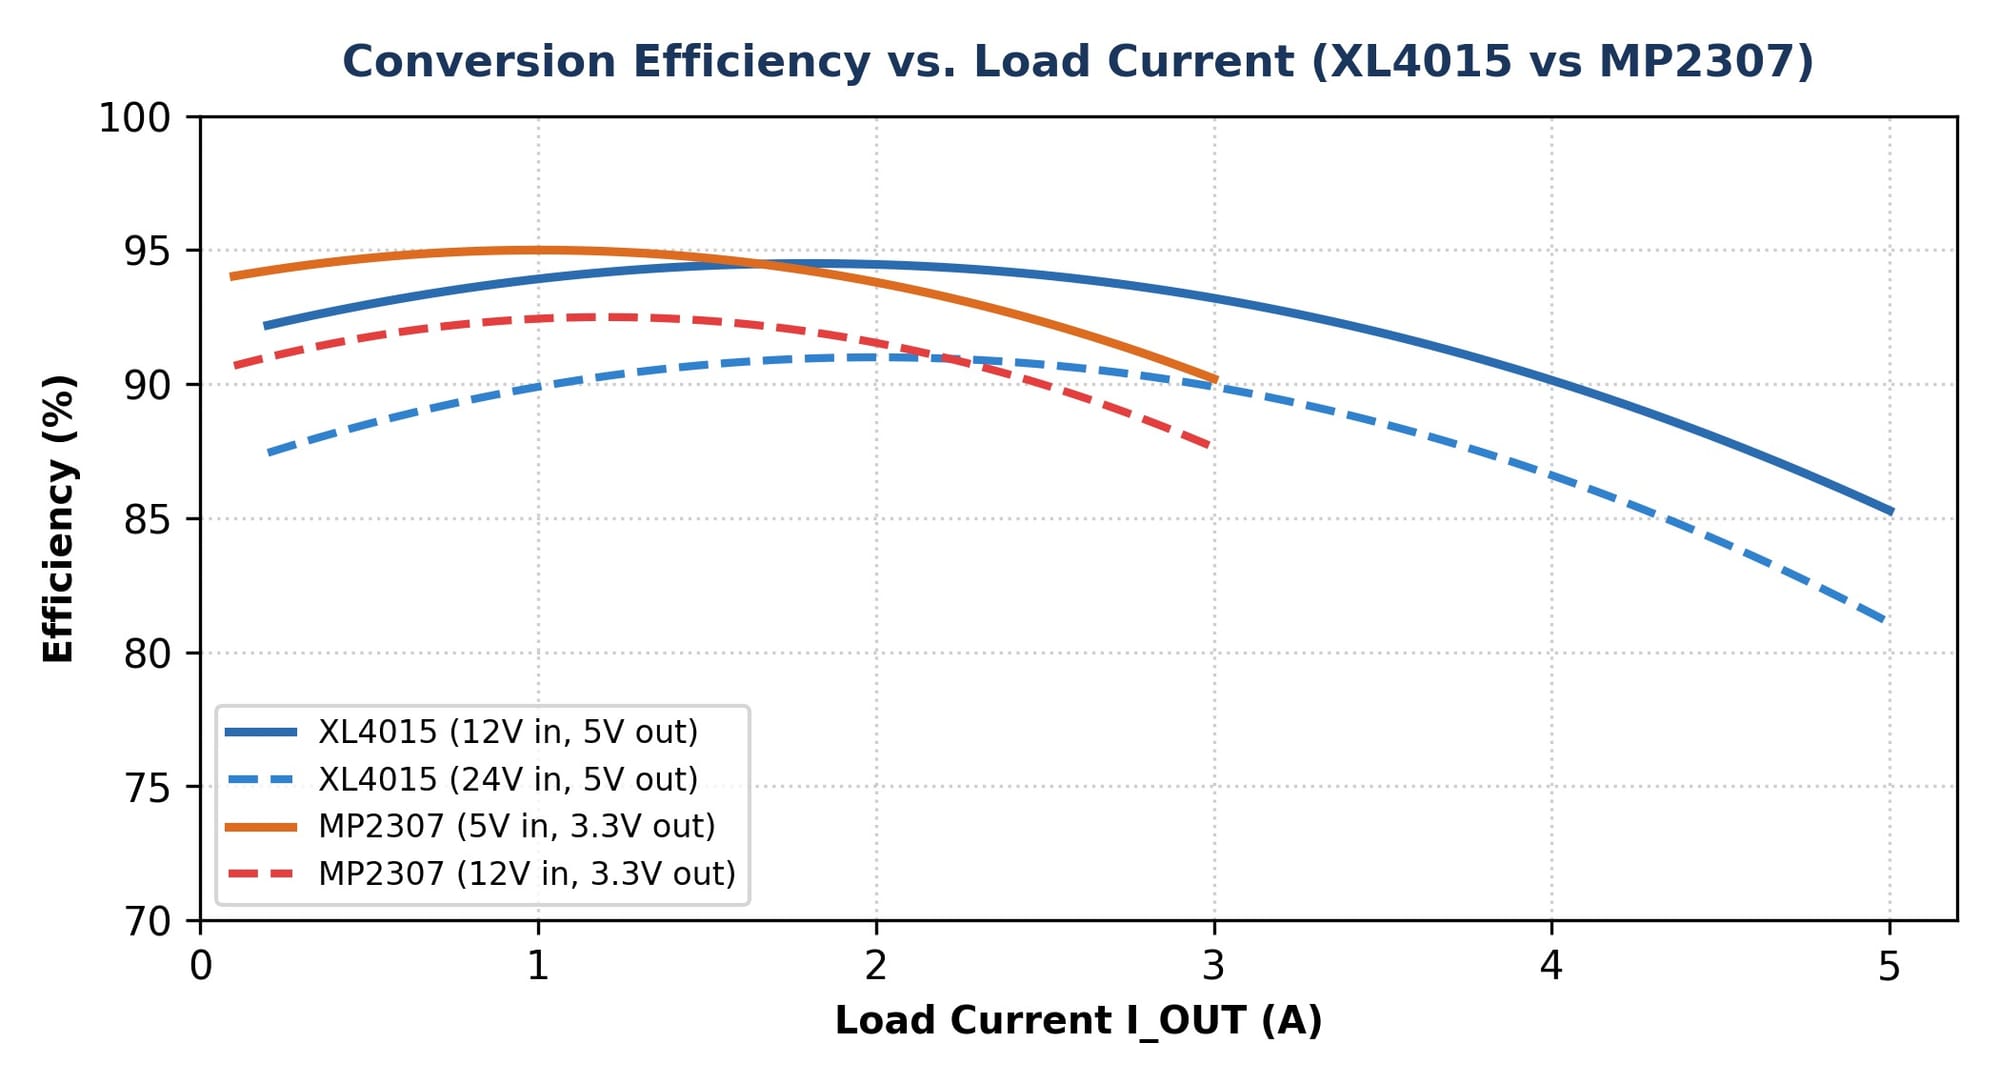
The graph makes that practical. The XL4015 curves use a 5 V output with 12 V or 24 V input; the MP2307 curves use a 3.3 V output with 5 V or 12 V input. Those are different operating points. I can examine what the lines show without turning them into a matched load sweep or a measurement I personally made.
The definition is straightforward: output power divided by input power. If I multiply by 100, I get a percentage. But the useful part is remembering that both powers have to belong to the same situation. The input voltage and current go together, and the output voltage and load current go together. A claimed percentage without those conditions leaves me guessing what the circuit was doing.
For a simple numerical example, imagine a converter delivering 5 V at 1 A. That’s 5 W of output power. At a 90% efficiency, it would need about 5.56 W at the input. The difference, about 0.56 W, is lost within the conversion. At a 95%, the required input power would be about 5.26 W, leaving about 0.26 W of loss. I kept the input conditions beside the results so I could compare them.
What interests me is the size of the change in loss. Five percentage points can sound small, but under those assumptions the loss drops by quite a lot. That could matter for heat and power use. At the same time, I can't take that calculation and claim a temperature improvement without understanding how heat leaves the particular board.
Now change the load. Some losses vary strongly with current, while others don't disappear just because the load is light. That’s why I want to see a curve rather than only a maximum. The peak may occur in one part of the load range. If the device spends most of its life somewhere else, the peak won't describe the way I'm actually using it.
The output voltage matters too. A loss expressed in watts has a different effect on the percentage when the useful output power changes. That makes a comparison between different output voltages harder to interpret. I need to avoid accidentally giving the topology credit for a change that came from the operating point.
I’m reading the efficiency illustration through its labelled operating points. A curve in a study and a sweep measured on a particular module are different kinds of information. The line can help me examine how efficiency changes with load, but its smoothness is not the reason to trust it. The conditions and the kind of result it represents belong with it.
Each of those sources can still be useful. A manufacturer's curve shows behaviour under its stated conditions. A model can show how a particular assumption affects the result. A bench measurement can describe the module and setup actually used. The mistake would be blending all three into one confident sentence without saying where the number came from.
Even measuring efficiency is more involved than reading a convenient display. The meters, connections and conditions matter, particularly if the loss is the small difference between two larger powers. If the input and output readings don't represent the same steady situation, their ratio can look more precise than it is. A meaningful efficiency sweep needs that complete measurement boundary, rather than only an attractive percentage.
I want a graph's labels to do more of the work. Input voltage, output voltage and load current should be easy to find. The source should be clear. If it is a calculated curve, its assumptions belong nearby. Then someone looking at the graph doesn't have to search through the whole report to discover what it is supposed to represent.
When I look up an efficiency claim, the useful follow-up is where the figure came from and what conditions go with it. A short answer can skip the exact thing I need. I can use the explanation to understand the terms, but I still have to return to the actual source before treating the number as part of this comparison.
For my mentor, I want to bring the curve and the operating point together. The question is no longer just why one line is higher. It’s whether that section of the curve describes the job I’m trying to compare, and whether both lines were obtained in a way that makes the comparison fair.
I find the graph more useful when I read across one labelled case at a time. A line at 12 V input and 5 V output describes a different job from one at 12 V input and 3.3 V output, even when both are plotted against load current. The loss equations explain why that difference matters: current, conducting fraction and switching all enter the balance. A curve is a way to study those relationships, not a reason to discard the conditions in its legend.
The percentage hasn't become less interesting. It has become more useful because I can connect it to power going into a real load and power becoming loss. I just need the two words beside it to stay visible. Up to is the beginning of the question, not a detail to crop out of the screenshot.